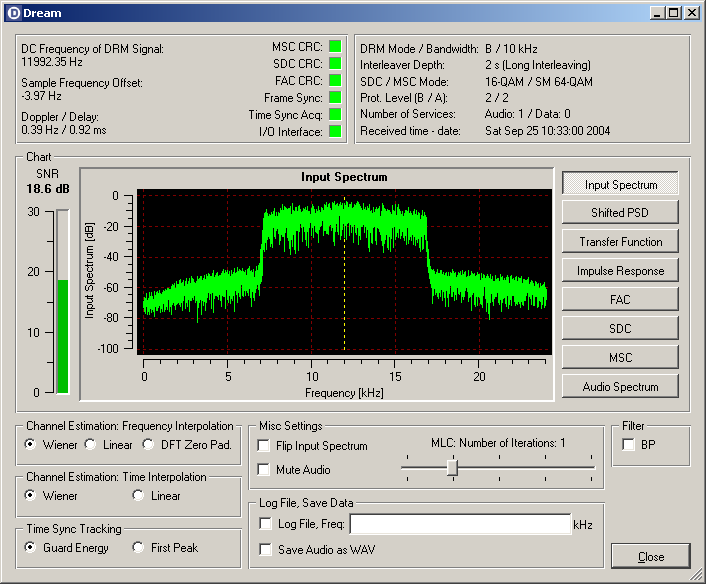
Evaluation Dialog DRM - Main Plot
|
In the center of the Evaluation Dialog there's a graphical display of different
vectors of the DRM decoder.
The different plots can be selected by the buttons on the right side. |
 |
 |
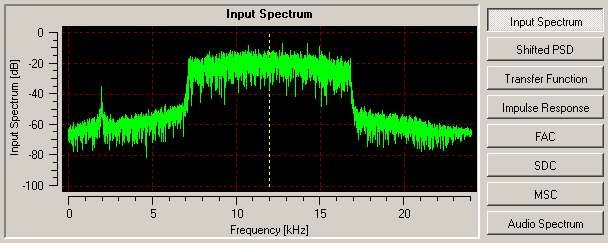
Input Spectrum
This plot shows the Fast Fourier Transformation (FFT) of the input signal.
This plot is active in both modes, analog and digital. There is no averaging
applied. The screen shot of the Evaluation Dialog shows the significant
shape of a DRM signal (almost rectangular). The dashed vertical line shows
the estimated DC frequency.
In AM mode this line is very important for the analog demodulation. Each
time a new carrier frequency is acquired, the red line shows the selected
AM spectrum. If more than one AM spectrums are within the sound card frequency
range, the strongest signal is chosen. |
 |
|
|
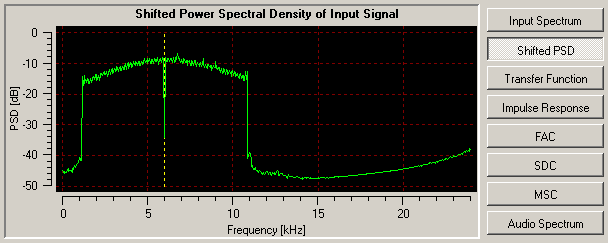
Shifted Power Spectral Density of Input Signal
This plot shows the estimated Power Spectrum Density (PSD) of the input
signal. The DC frequency (yellow dashed vertical line) is fixed at 6 kHz.
If the frequency offset acquisition was successful, the rectangular DRM
spectrum should show up with a center frequency of 6 kHz. This plot represents
the frequency synchronized OFDM spectrum. If the frequency synchronization
was successful, the useful signal really shows up only inside the actual
DRM bandwidth since the side loops have in this case only energy between
the samples in the frequency domain. On the sample positions outside the
actual DRM spectrum the DRM signal has zero crossings because of the orthogonality.
Therefore this spectrum represents not the actual spectrum but the
"idealized" OFDM spectrum. (The screenshot was taken with BP filter off.) |
 |
|
|
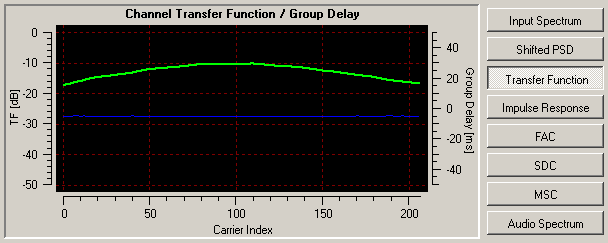
Channel Transfer Function / Group Delay
This plot shows the squared magnitude (green line) and the group delay (blue
line) of the estimated channel at each sub-carrier. |
 |
|
|
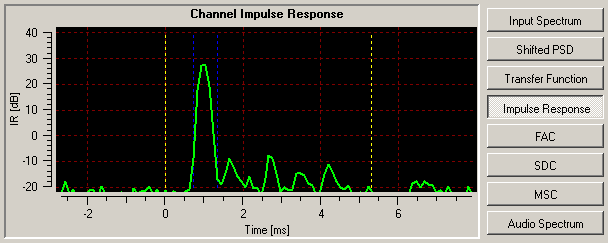
Channel Impulse Response
This plot shows the estimated Impulse Response (IR) of the channel based
on the channel estimation. It is the averaged Hamming Window weighted Fourier
back transformation of the transfer function. The length of PDS estimation
and time synchronization tracking is based on this function. The yellow
dashed vertical lines show the beginning and the end of the guard-interval.
The two blue dashed vertical lines show the estimated beginning and end
of the PDS of the channel (derived from the averaged impulse response estimation).
If the "First Peak" timing tracking method is chosen, a bound for peak estimation
(horizontal dashed yellow line) is shown. Only peaks above this bound are
used for timing estimation. |
 |
|
|
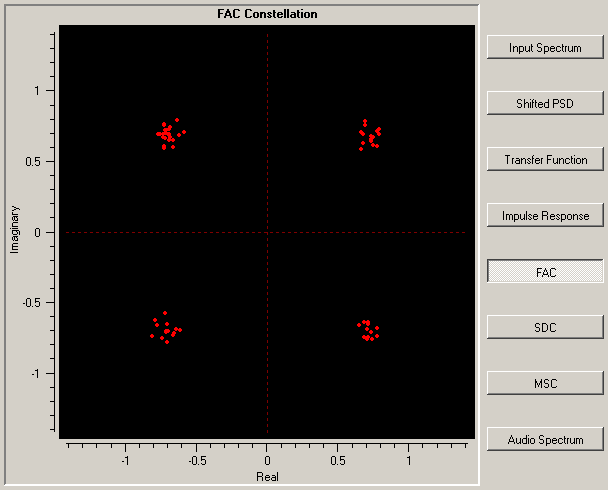
FAC Constellation
This plot shows the constellation of the FAC logical channel of the DRM
stream. The FAC has 4-QAM modulation. (To get a realistic view the Evaluation
Dialog should be stretched vertically.) |
 |
|
|
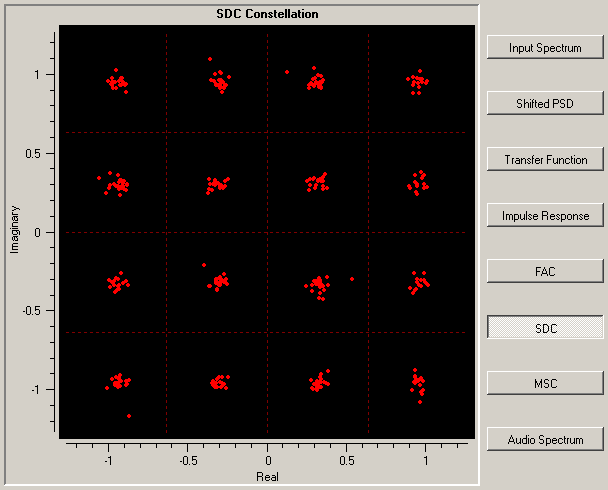
SDC Constellation
This plot shows the constellation of the SDC logical channel of the DRM
stream. Depending on the current transmitter settings the SDC can have 4-QAM
or 16-QAM modulation. (To get a realistic view the Evaluation Dialog should
be stretched vertically.) |
 |
|
|
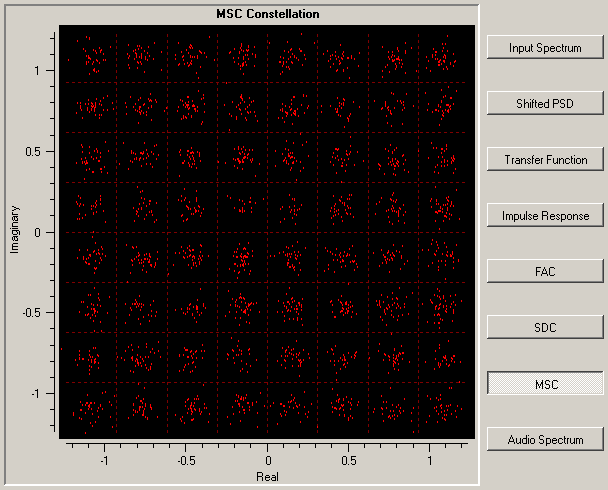
MSC Constellation
This plot shows the constellation of the MSC logical channel of the DRM
stream. Depending on the current transmitter settings the MSC can have 16-QAM
or 64-QAM modulation. (To get a realistic view the Evaluation Dialog should
be stretched vertically.) |
 |
|
|
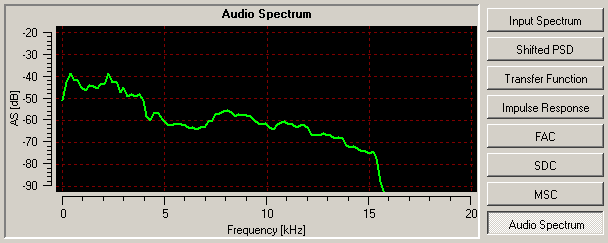
Audio Spectrum
This plot shows the frequency spectrum of the AAC encoded audio signal. |
 |
|
|